Use the (engine) source, Luke!
One of the great touted benefits of Unreal Engine (over an engine such as Unity¹) is source code access.
That is, when an engine API doesn't work as expected or online documentation fails you — or if you're simply curious how things work — you can trace through engine-level code with a debugger to understand what's actually going on.
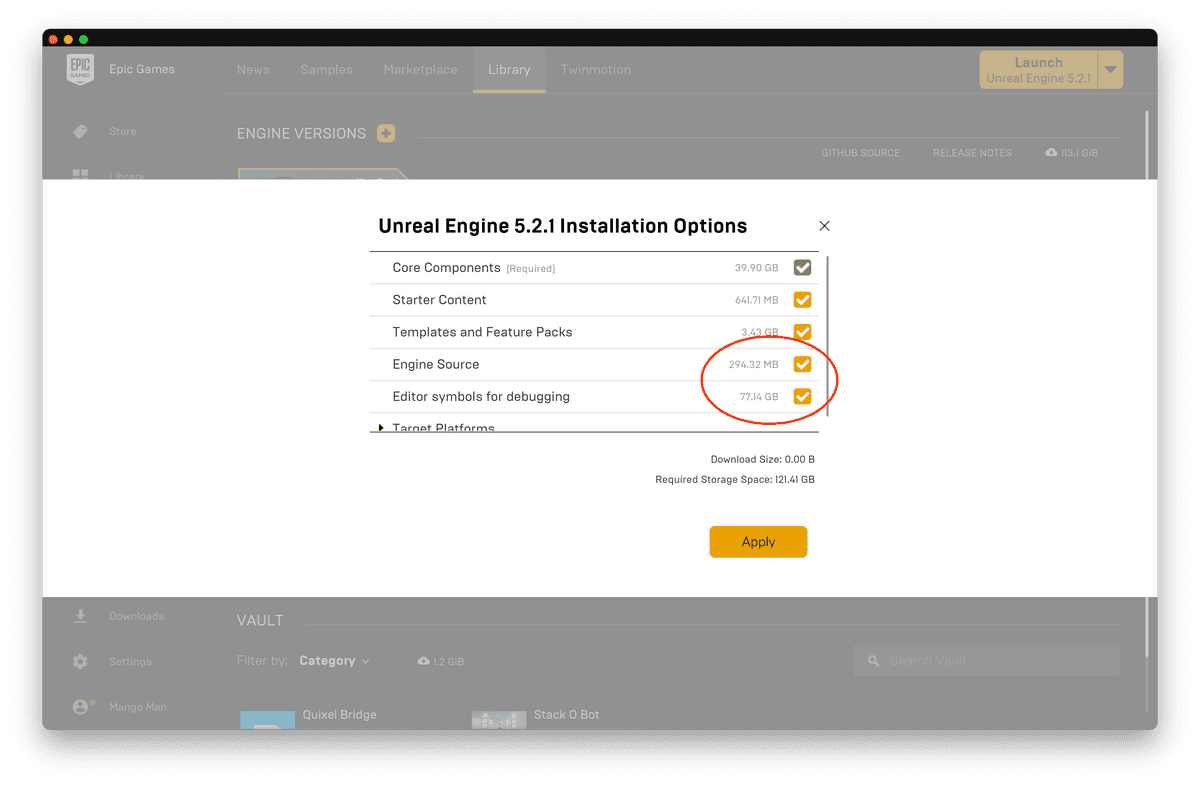
All you need is to install the engine source along with debug symbols in the Epic Launcher — no need to re-build the engine from source:
And you're set! Right?
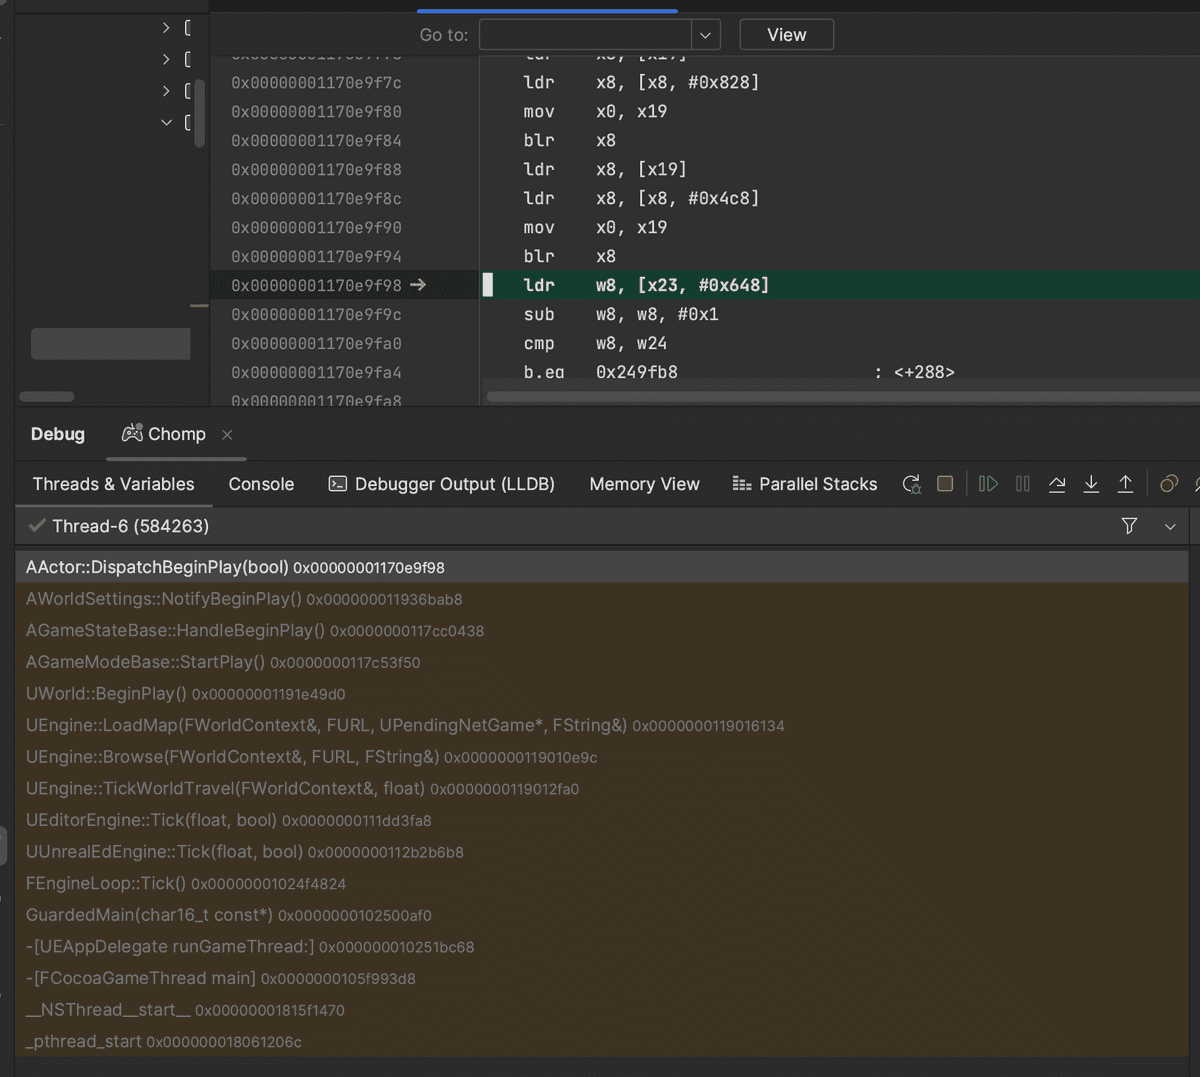
Sadly, while the buck stops here for Windows users, Mac users may be frustrated to see that debug symbols are not automatically used:
That is, if you set a breakpoint on a line in your game's C++ source, the call stack might display function signatures, yet display no line mappings to engine source code. Effectively, the engine remains a black box to you.
The solution?
You need to load those debug symbols somehow, so that lldb (the debugger technology behind all visual debuggers on Macs) knows of them.
Surprisingly, this is not automatic nor is it documented in Unreal's official docs for Mac users, but it is the key to unlocking source code transparency on your Unreal projects.
So here's how to do it 👇
Step 1: Install the source and debug symbols through the Epic Launcher
Open up the Epic Games Launcher, navigate to your Unreal Engine version's install options, and tick the Engine Source and Editor symbols for debugging checkboxes. Then hit apply:
This will kick off downloads for the engine source code and debug symbols, respectively. At nearly 80 GB, they are hefty (but worthwhile) downloads, so make sure you have disk space available before hitting apply.
It will take a bit of time, so set your Mac to not sleep in your Lock Screen System Settings, and kick off the download before doing some chores (or otherwise).
Step 2: Verify that .dSYM files have been installed
Once both the source code and debug symbols have finished installing, you should verify that those files are present.
For source code, you can run the following command to verify the presence of C++ engine source:
$ cd '/Users/Shared/Epic Games/UE_5.2/Engine/Source'
$ find . -name '*.cpp'
Likewise for debug symbols. Note that the file extension on Macs is .dSYM, not .pdb as it is on Windows:
$ cd '/Users/Shared/Epic Games/UE_5.2/Engine/Binaries/Mac'
$ find . -name '*.dSYM'
Once verified, you can move onto the next step...
Step 3: Understand how .dSYM files work
Sadly, these .dSYM files don't do anything unless you load them. That is, you won't see useful line numbers in your debugging call stacks by default:
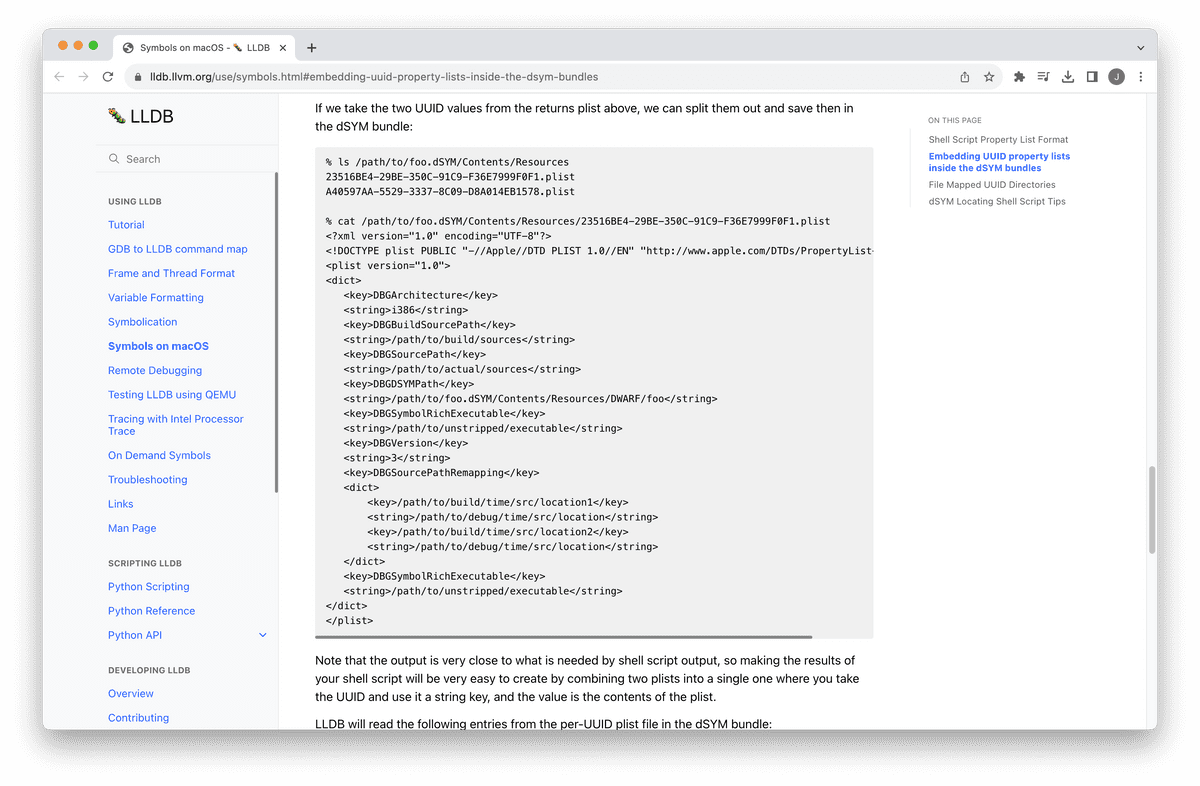
To configure lldb to load your .dSYM files automatically, you need a bit of tribal knowledge. To quote the docs,
Since dSYM files are bundles, you can also place UUID info plists files inside your dSYM bundles in the Contents/Resources directory. One of the main reasons to create the UUID plists inside the dSYM bundles is that it will help LLDB and other developer tools show you source. LLDB currently knows how to check for these plist files so it can automatically remap the source location information in the debug info.
Basically, your .dSYM files currently contain hard-coded paths to source code at their original build location, such as:
/build/Epic Games/UE_5.2/Engine/Source/Runtime/Engine/Private/EngineTypes.cpp
But we should remap those hard-coded paths to point to source code files on your machine:
/Users/Shared/UE_5.2/Engine/Source/Runtime/Engine/Private/EngineTypes.cpp
To perform this remapping, each of your .dSYM files require a bit of additional metadata in the form of .plist XML files. Adding this additional metadata will tell lldb to automatically load your .dSYM files:
So let's add the metadata...
Step 4: Configure the remappings in your .dSYM files
There are a lot of .dSYM files in your Unreal Engine install. You can count them:
$ find . -name '*.dSYM' | awk '!/Resources/' | wc -l # prints 1772 on my install
So writing all of these .plist files by hand is out of the question. You need a little script to write these .plist files for you.
Luckily, a developer who goes by intvoker on the Unreal Engine forums has customized a script to do just that. The steps:
- Download the (Ruby) script to your machine.
- Install the script's dependencies:
$ sudo gem install fileutils optimist plist. - At the bottom of the script, customize the default
:pathand:source_path. For Unreal Engine 5.2, the updated code block will contain these strings at the ends of the lines:
options = Optimist.options do
  opt :path, 'Path to the binaries and dSYMs (e.g. "/Users/Shared/Epic Games/UE_4.23/Engine/Binaries/Mac")', type: :string, default: '/Users/Shared/Epic Games/UE_5.2/Engine/Binaries/Mac'
  opt :source_path, 'Path to the local source directory (e.g. "/Users/Shared/Epic Games/UE_4.23")', type: :string, default: '/Users/Shared/Epic Games/UE_5.2'
end
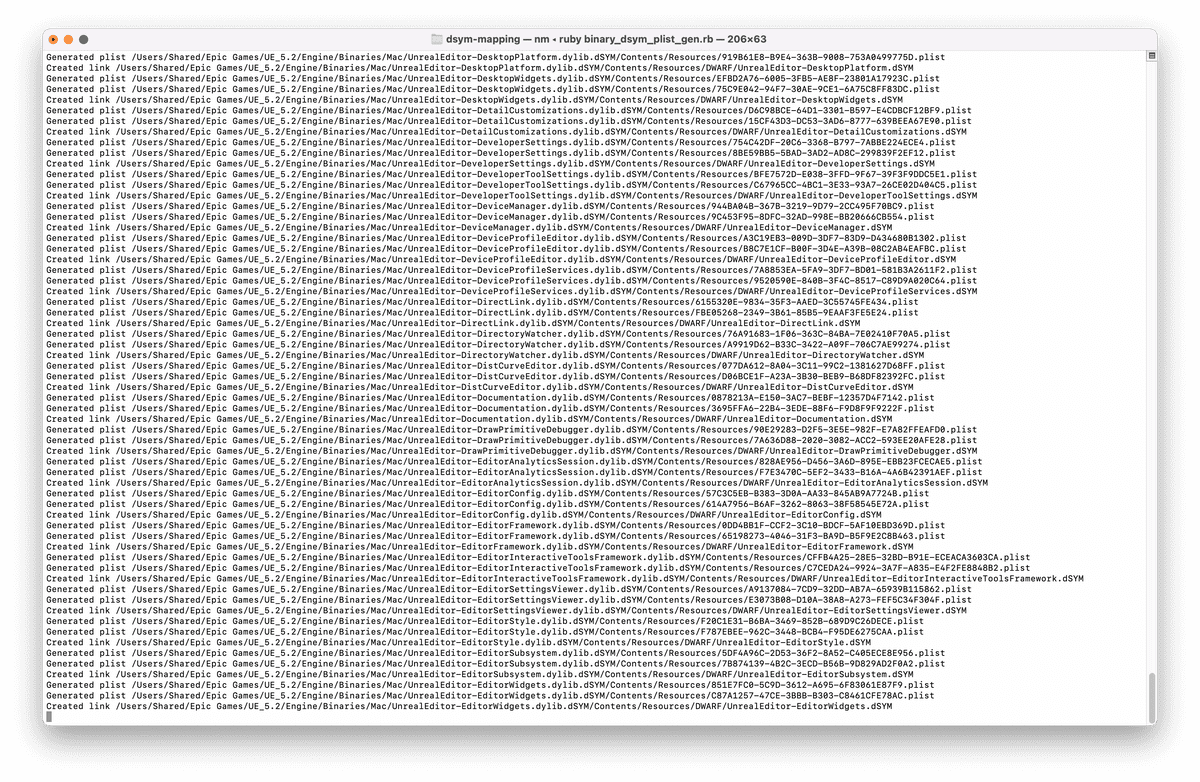
Then run the script: $ ruby binary_dsym_plist_gen.rb. The script's logs should report your .plist files being generated and placed within the .dSYM bundles' Contents/Resources directories:
Once complete, your debug symbols should be ready to go. Let's test it out.
Step 5: Try debugging in your Unreal IDE
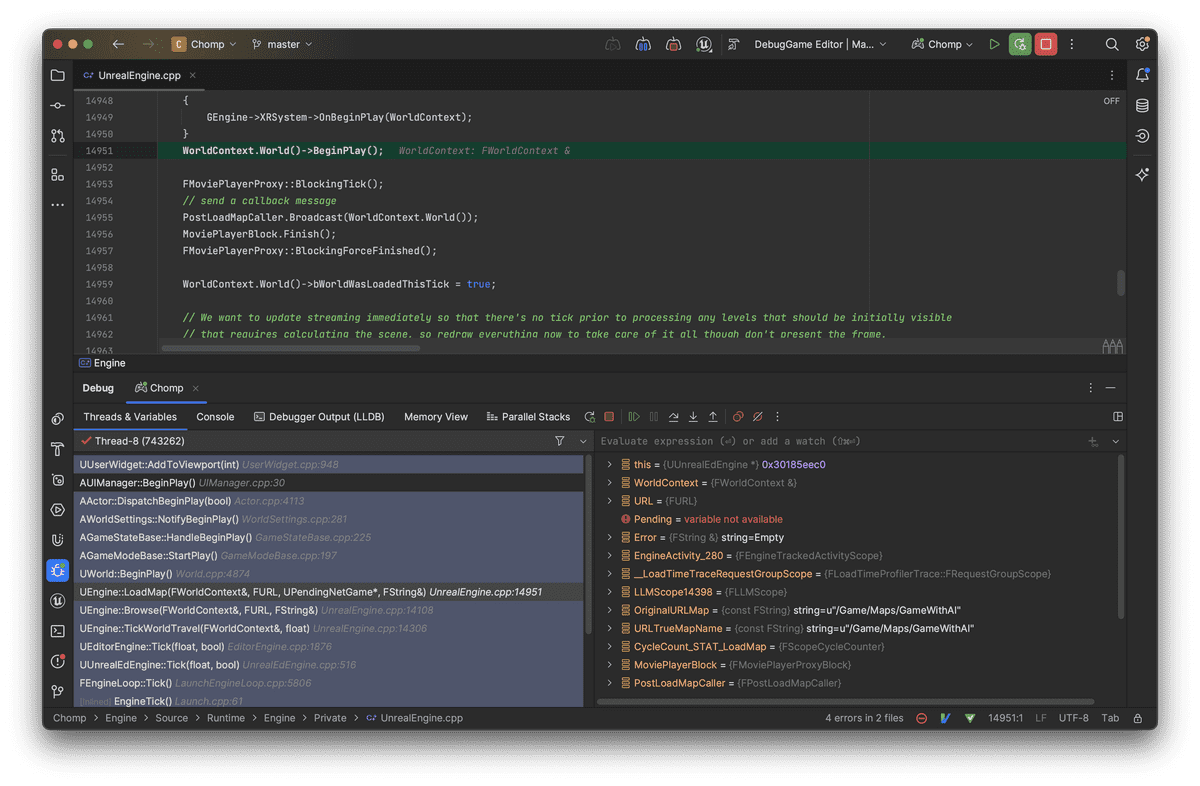
With your .dSYM files properly configured for lldb to automatically load them, your call stacks will now map to the underlying engine source. Here's me giving the setup a go in JetBrains Rider:
And you can click on functions within your call stack to understand what's going on in the engine. Nifty, eh? Where the docs lie, the source code tells all.
Conclusion
You don't need to build Unreal from source to use debug symbols.
Yet, while debug symbols Just Work™ on Windows, Mac users need just an extra bit of under-documented configuration.
If you're a Mac user like myself, I hope this allows us to build a deep understanding of our engine technology.
That's all. Until next time!
Resources
Here are some helpful links for further learning:
- A blog post describing the original
.plistgeneration technique: https://medium.com/@maxraskin/background-1b4b6a9c65be - intvoker's post on the Unreal Engine forums: https://forums.unrealengine.com/t/debugging-on-macos-using-dsym-files-provided-by-ue4-installer/152009
- intvoker's
.plistgeneration script, customized for Unreal usage: https://gist.github.com/intvoker/46450ab4090c6edbc4794af99caf181d - LLVM's official docs on how debug symbols work: https://lldb.llvm.org/use/symbols.html#embedding-uuid-property-lists-inside-the-dsym-bundles
- In these modern times, ChatGPT is always helpful for demystifying jargon: https://chat.openai.com
¹ Unity offers source code access as part of its Source Code offering, but you'd need an enterprise plan/contract to access it. Which is out of reach if you're just getting started. 🔝
